See MIT link to the right.
Wednesday, February 18, 2009
An interesting link
I just saw an article that discussed an interesting use of GIS: A theory to capture Osama bin Laden!
Sunday, November 23, 2008
Saturday, November 22, 2008
Working with Styles assignment.
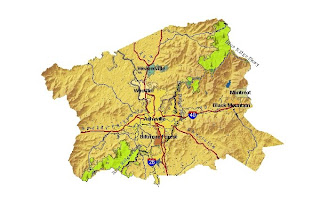
I used the kuler.adobe site to create compatible colors for symbols on this map of Buncombe County, and as a starting point for color ramps for elevation and hillshade. I found that the colors didn't look quite the same in ArcMap as they did in Kuler, so ended up tweaking them a lot.
I used the kuler.adobe site to create compatible colors for symbols on this map of Buncombe County, and as a starting point for color ramps for elevation and hillshade. I found that the colors didn't look quite the same in ArcMap as they did in Kuler, so ended up tweaking them a lot.

Tuesday, September 2, 2008
LEAF map GIS-121
Friday, August 29, 2008
GIS-111 "Wind Power" Map

I used to draw maps by hand, but they look so much better when done by the computer. The challenge for me is to learn what ArcMap can do, and remember how to get it to do those things.
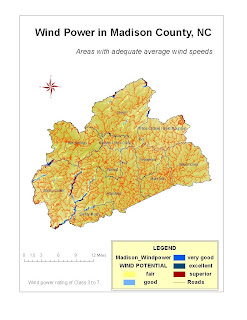
This map is my GIS-111 final project, which is an attempt to show areas that have the best potential to produce wind power in Madison County, N.C.
Based on average wind speed data from a regional wind map, I factored in slope and aspect (direction a slope faces) from DEM's to rank the parts of the county's ridgetops that hold potential for generating power from the wind.
Subscribe to:
Comments (Atom)


